Wedges in Technical Analysis
Falling & Rising Wedges
What are the wedges. How they formed on the chart and How to use them in Trading. In today article, we will learn about the rising and falling wedges. Wedges are chart patterns that indicate a potential reversal or continuation in price movement. They can be categorized as falling wedges (descending) or rising wedges (ascending). They are formed by two converging trendlines merge at a apex. (support & resistance).
1. Falling Wedge (Bullish Reversal or Continuation)
Shape:
- Upper trendline slopes downward (resistance).
- Lower trendline slopes downward but at a steeper angle (support).
- Price gets squeezed between these two lines.
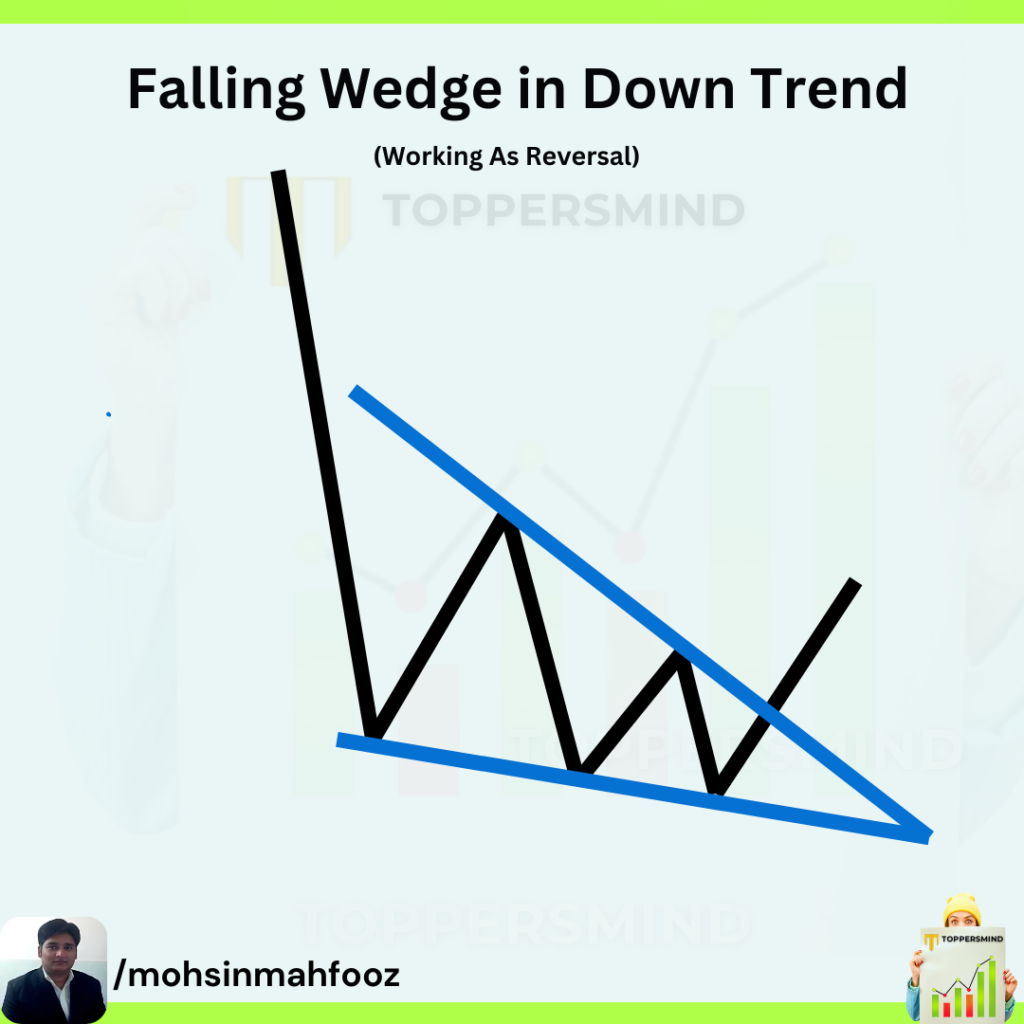
Falling wedge in a Downtrend : In the above Chart you can see that stock is in down trend and making lower high’s and lower low’s. High’s and lows are shifting downwards and the gap is getting closer between the two lines. So, Falling Wedge act as a reversal pattern on the chart.
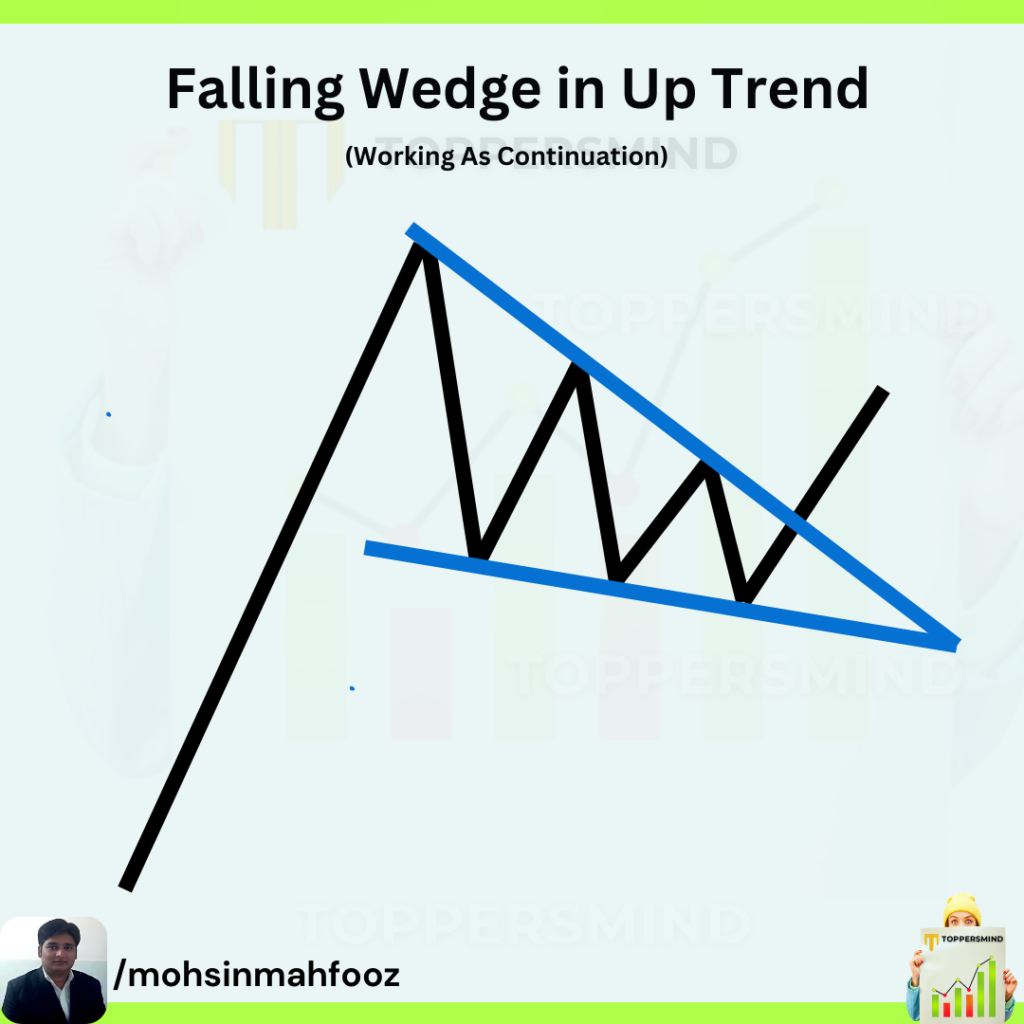
Falling Wedge in Uptrend : In the above example , You can see that stock is in Uptrend But making lower high’s and lower low’s. High’s and lows both are shifting downwards and the gap is getting closer between the two lines. So, Falling Wedge act as a Continuation pattern on the chart.
Interpretation:
- In a Downtrend: Signals a bullish reversal (price breaks upward).
- In an Uptrend: Acts as a bullish continuation pattern (pause before resuming uptrend).
How to Trade a Falling Wedge?
- Wait for the breakout above the upper trendline.
- Entry: Buy after a confirmed breakout (closing above resistance).
- Target: Measure the height of the wedge and project it upward.
- Stop-loss: Below the recent swing low or wedge support.
2. Rising Wedge (Bearish Reversal or Continuation)
Shape:
- Lower trendline slopes upward (support).
- Upper trendline slopes upward but at a steeper angle (resistance).
- Price gets compressed between these lines.
Interpretation:
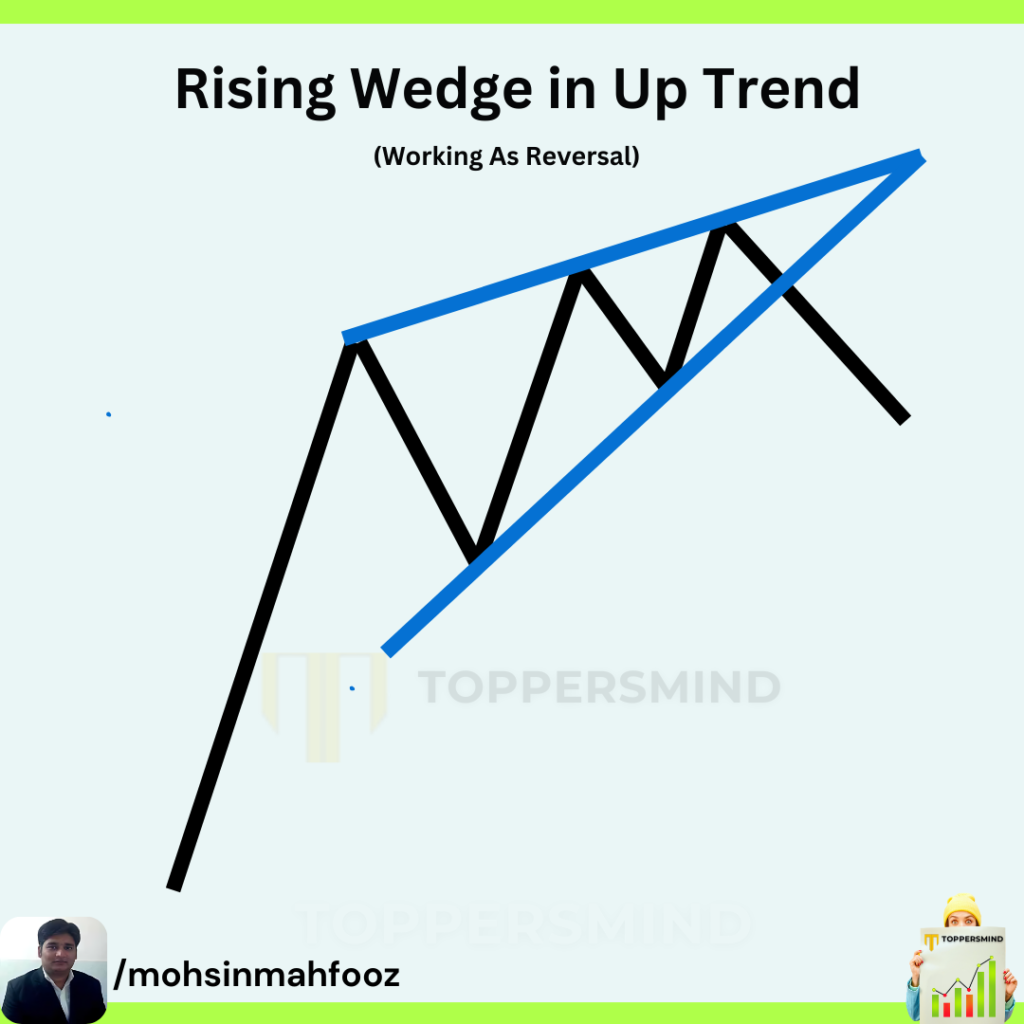
- In an Uptrend: Signals a bearish reversal (price breaks downward).
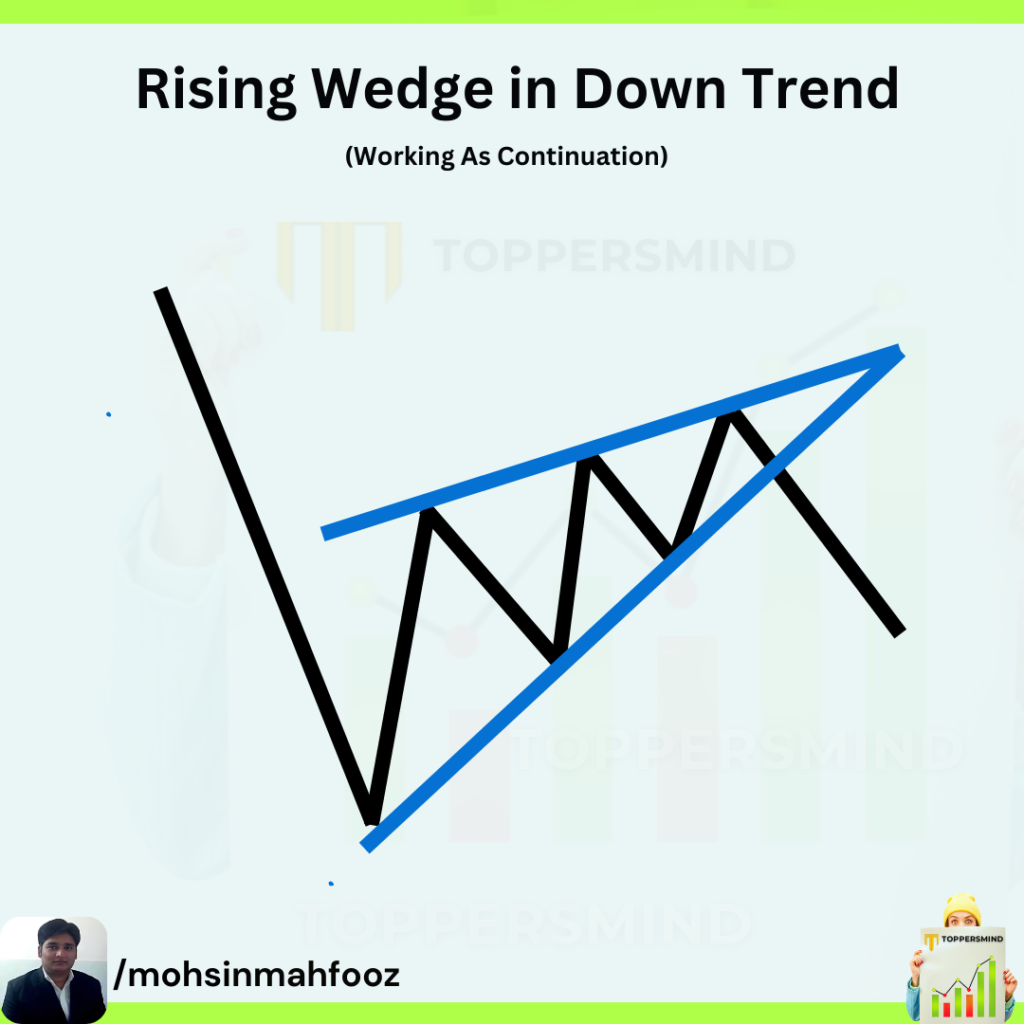
- In a Downtrend: Acts as a bearish continuation pattern (pause before resuming downtrend).
How to Trade a Rising Wedge?
- Wait for the breakdown below the lower trendline.
- Entry: Sell after a confirmed breakdown (closing below support).
- Target: Measure the height of the wedge and project it downward.
- Stop-loss: Above the recent swing high or wedge resistance.
Key Differences Between Falling & Rising Wedges
| Feature | Falling Wedge | Rising Wedge |
|---|---|---|
| Slope | Both trendlines slope downward (upper less steep). | Both trendlines slope upward (lower less steep). |
| Breakout Direction | Upward (Bullish) | Downward (Bearish) |
| Common Context | Reversal in downtrend / Continuation in uptrend. | Reversal in uptrend / Continuation in downtrend. |
| Volume | Volume decreases inside wedge, increases on breakout. | Volume decreases inside wedge, increases on breakdown. |
Important Notes:
✅ Confirmation is Key: Always wait for a close outside the wedge before trading.
✅ Volume Matters: Breakouts with higher volume are more reliable.
✅ False Breakouts Happen: Use stop-loss to manage risk.
Wedges are powerful patterns when combined with support/resistance, trendlines, and volume analysis. Mastering them can improve your reversal and continuation trading strategies.
Want to learn Technical Analysis Course in Delhi. Join our offline course and become an expert Technical Analyst. Follow us on Instagram