Double Top Chart Pattern

Double Top Pattern: Explained
Today, we will learn about the Double Top Chart Pattern, How it forms, How to trade and predict the trade using this pattern.
Meaning of Double Top Pattern
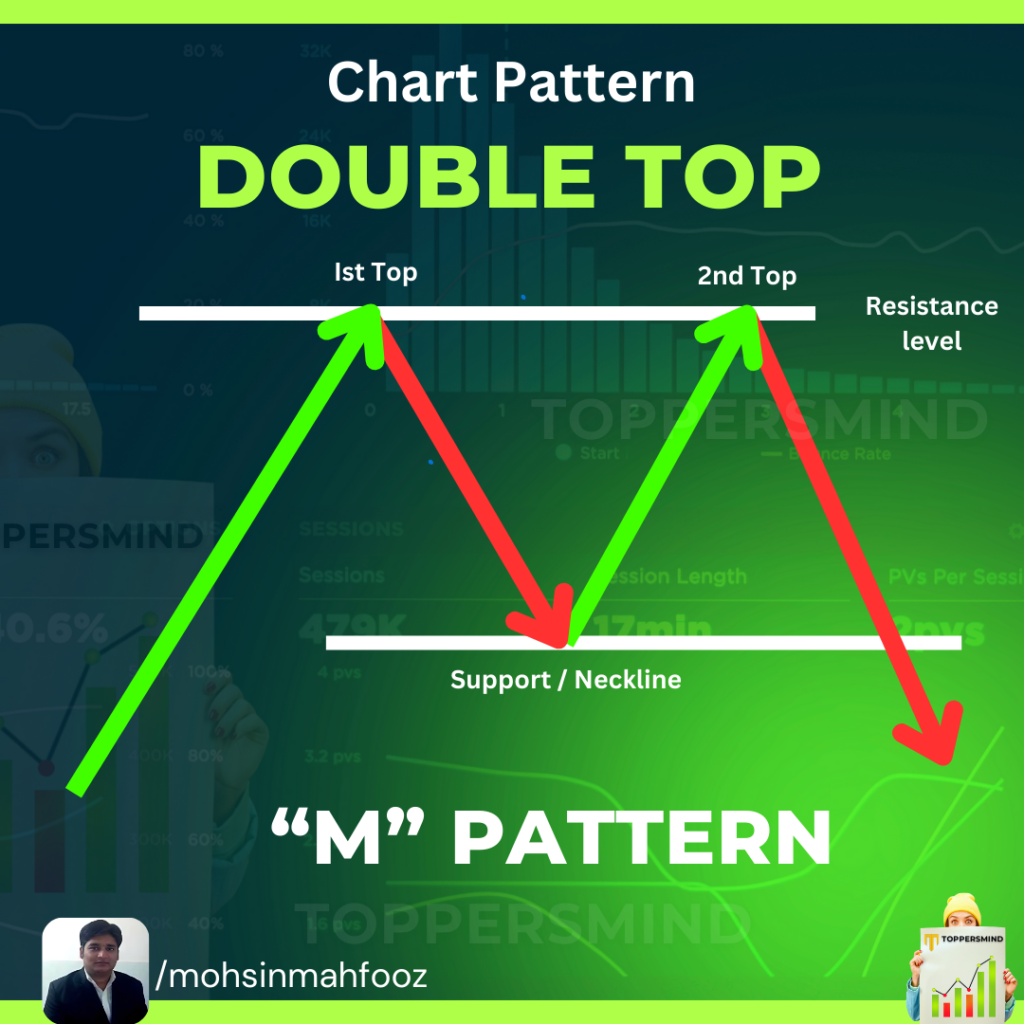
The Double Top is a bearish reversal chart pattern that forms after an extended uptrend. It resembles the letter “M” as the price tests a resistance level twice, creating two distinct peaks at similar price levels, followed by a breakdown below a key support level. This pattern signals a potential reversal in market direction from bullish to bearish.
Formation of Double Top Pattern
- First Peak: The price rises to a resistance level, faces selling pressure, and retraces downwards.
- Retracement: After the first peak, the price retraces to a support level, often referred to as the neckline.
- Second Peak: The price rises again but fails to break the resistance level of the first peak.
- Breakdown: Once the price breaks below the neckline (support level), the pattern is confirmed, suggesting a bearish trend ahead.
How to Trade a Double Top Pattern?
- Identify the Pattern: Look for two distinct peaks at similar levels and a neckline below.
- Confirm the Breakout: Wait for the price to close below the neckline to confirm the pattern.
- Enter a Short Position: Place a short trade after the breakdown, ideally on a retest of the neckline.
- Stop-Loss Placement: Place a stop-loss slightly above the second peak to manage risk.
- Target Price: The potential profit target is typically equal to the height between the peaks and the neckline, subtracted from the breakout point.
Advantages of a Double Top Pattern
- Reliable Reversal Signal: It helps traders anticipate a trend reversal.
- Clear Entry and Exit Points: The neckline provides a clear breakout level, and the peak offers a stop-loss point.
- Profitability: Offers significant profit opportunities if traded correctly.
Disadvantages of a Double Top Pattern
- False Breakouts: The price may temporarily break below the neckline and then reverse, causing losses.
- Requires Confirmation: Without volume or a clear breakdown, it may not confirm a bearish trend.
- Time-Consuming Formation: The pattern takes time to develop, requiring patience.
FAQs About Double Top Pattern
Q1. Can a Double Top Pattern form in intraday trading?
Yes, it can form on any timeframe, including intraday charts, but the reliability is higher on longer timeframes.
Q2. How can I confirm a Double Top Pattern?
Confirmation occurs when the price breaks below the neckline with increased volume.
Q3. Is the Double Top Pattern always accurate?
No, like all patterns, it is not foolproof and requires additional confirmation tools like volume analysis or indicators.
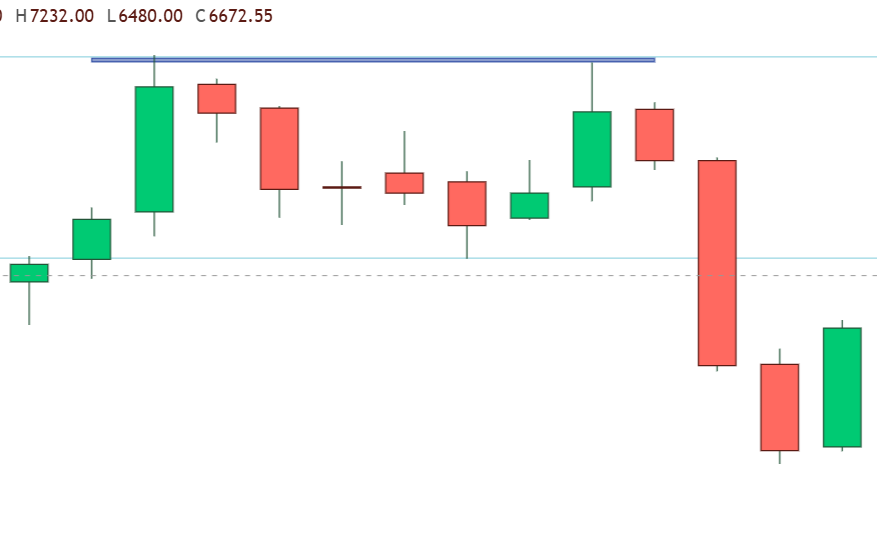
Double Top Pattern on Maruti Chart

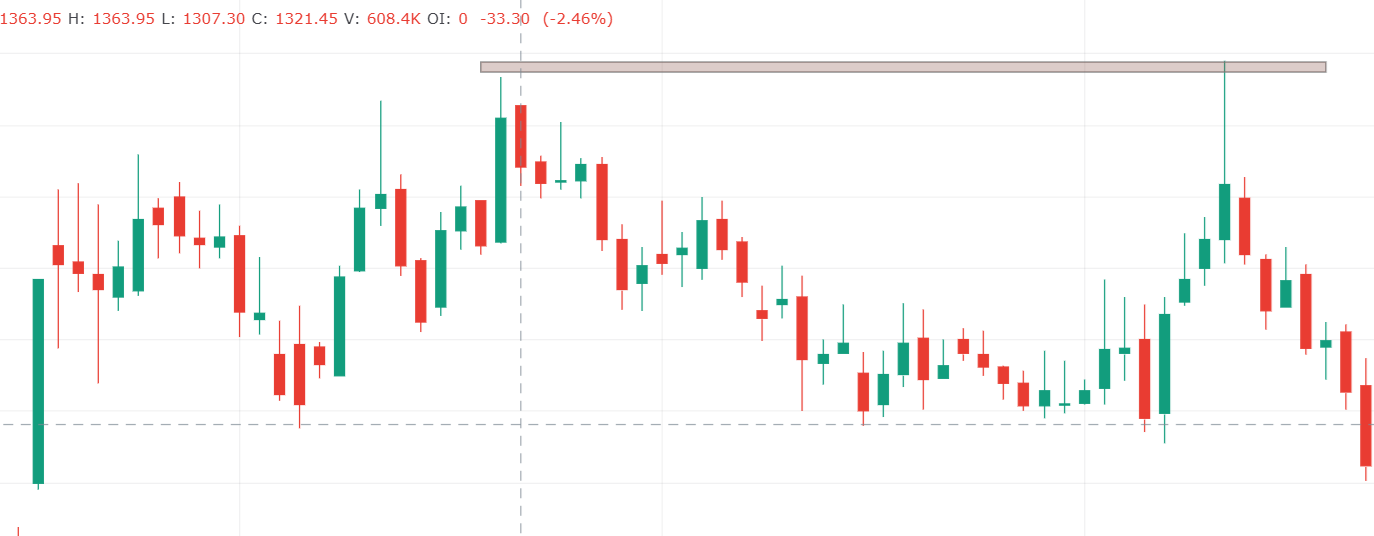
Double Top Pattern on Just Dial Chart

Would you to learn Technical Analysis Course in Delhi Call us Now 8287996284