Bullish Butterfly Harmonic Pattern

Understanding the Bullish Butterfly Harmonic Pattern
The Bullish Butterfly Harmonic Pattern is a sophisticated trading strategy that offers traders an opportunity to capitalize on potential market reversals. This pattern, a derivative of the well-known Gartley and Bat patterns, provides precise levels for entry, stop-loss, and target points. When spotted, it signals a potential bullish reversal, allowing traders to buy low before a price surge.
Structure of the Bullish Butterfly Pattern
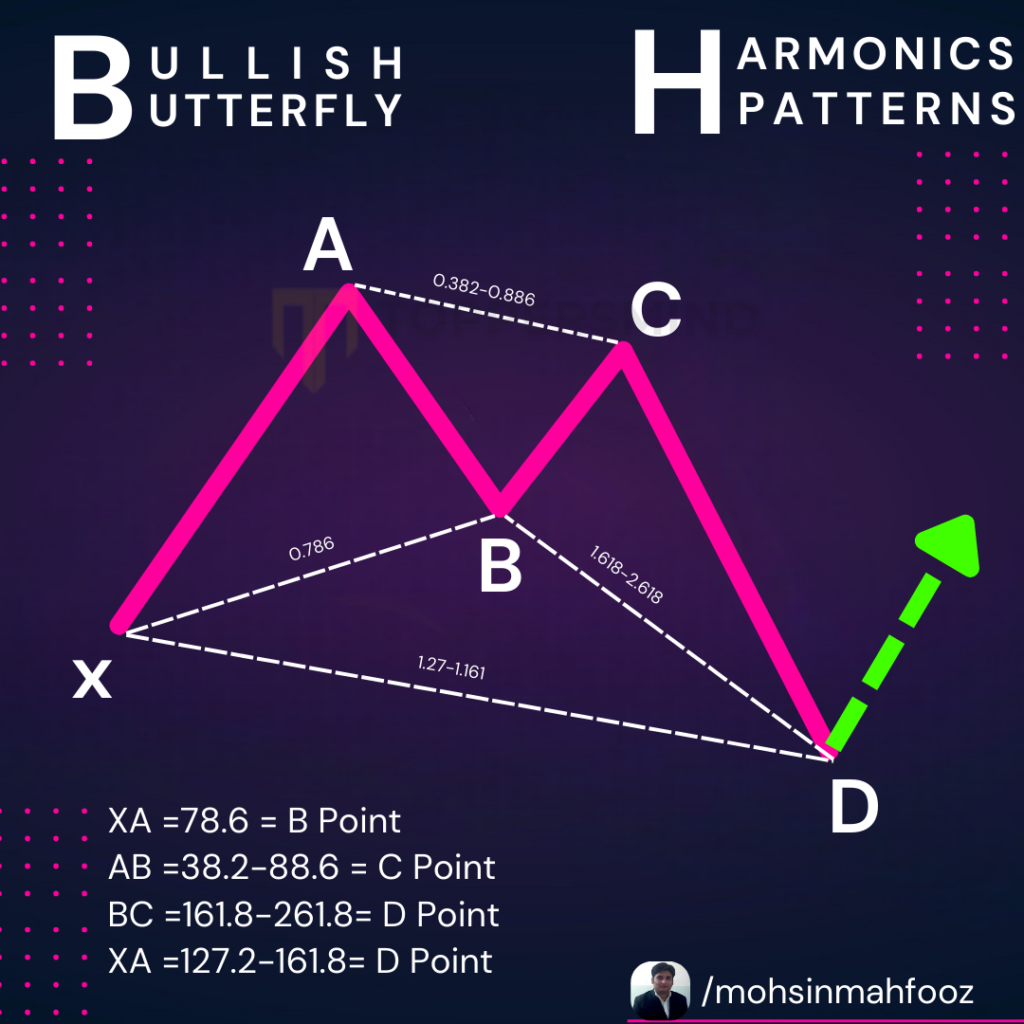
The Bullish Butterfly is composed of five points, labeled X, A, B, C, and D, which form four legs: XA, AB, BC, and CD. The key Fibonacci levels play a crucial role in confirming the pattern.
- XA Leg: This is the initial price movement, often a sharp bullish or bearish move.
- AB Leg: The AB leg retraces around 78.6% of the XA leg.
- BC Leg: BC retraces between 38.2% and 88.6% of the AB leg.
- CD Leg: The final leg, CD, extends beyond the XA leg, often reaching 127.2% or 161.8% of XA, forming the Butterfly’s distinct wing shape.
The D point is the potential reversal zone (PRZ), where traders look for price exhaustion and expect a reversal.
Key Fibonacci Ratios in the Bullish Butterfly
- XA Retracement (AB): Should be around 78.6%.
- BC Retracement: Ideally between 38.2% and 88.6% of the AB leg.
- CD Extension: The CD leg typically extends 127.2% or 161.8% of XA, forming the PRZ.
Entry, Stop-Loss, and Targets
- Entry Point: Traders should look to enter near point D, at the 127.2% or 161.8% Fibonacci extension of XA. This zone acts as a key support area, indicating a potential bullish reversal.
- Stop-Loss: A stop-loss is generally placed just below the D point, giving room for slight volatility but protecting the trader if the pattern fails.
- Target Points:
- First target at 38.2% Fibonacci retracement of the CD leg.
- Second target at 61.8% retracement of the same leg.
Trading Tips for the Bullish Butterfly
- Confirmation: Look for reversal candlestick patterns (e.g., bullish engulfing or hammer) around the D point for added confirmation.
- Divergence: Using RSI or MACD divergence can further confirm potential reversals.
- Patience: The Butterfly pattern can take time to develop fully. Wait for price action to confirm before entering.
Example of a Bullish Butterfly Pattern
Imagine the price action forming a deep XA leg, followed by an AB leg that retraces 78.6% of the XA move. The BC leg retraces about 50% of AB, leading to a final CD leg that extends 127.2% of XA. As the price approaches the D point, traders should be on high alert for reversal signals, ready to capitalize on a strong bullish move.
Click here to know about Bearish Butterfly Harmonic Pattern
If you are looking for Technical Analysis course in Delhi Call us Now 8287996284