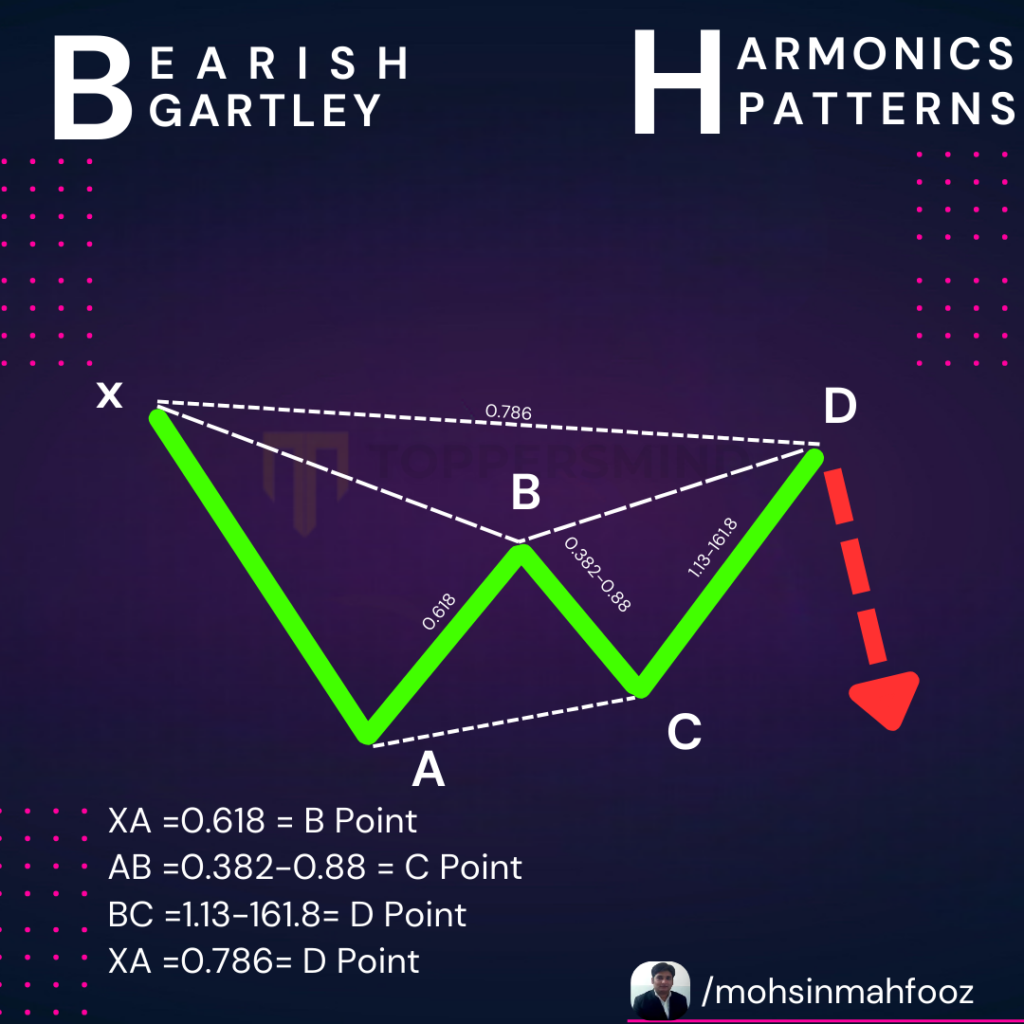
Bearish Gartley Harmonic Pattern
The Bearish Gartley Harmonic pattern is a classic chart formation that signals a potential reversal at the peak of an uptrend. Popular among technical analysts, this pattern provides reliable clues about price movements and offers opportunities for traders to enter short positions. Let’s break down the key components, identification methods, and strategies for effectively trading this pattern.

What is the Bearish Gartley Harmonic Pattern?
Named after H.M. Gartley, the Bearish Gartley is part of the harmonic pattern family. It combines Fibonacci retracement and extension levels to define price movements. This pattern typically appears during an uptrend and indicates an upcoming bearish reversal, allowing traders to capitalize on the downtrend.
Key Characteristics of the Bearish Gartley Pattern
- Four Points (X, A, B, C, and D): The pattern is structured by a series of peaks and troughs, denoted as X, A, B, C, and D. Point D is the potential reversal point.
- Fibonacci Ratios: The pattern is defined by specific Fibonacci levels, making these measurements crucial for identification:
- XA Leg: A strong upward move that sets the foundation for the pattern.
- AB Retracement: Should ideally retrace 61.8% of the XA leg.
- BC Extension: Extends to around 38.2%–88.6% of the AB leg.
- CD Completion: The critical final move, where the CD leg retraces about 78.6% of the XA leg, marking the potential reversal point.
How to Identify the Bearish Gartley Pattern
- Locate an Uptrend: The pattern typically appears at the top of a trend, so look for an uptrend to find this formation.
- Identify the Points and Legs: Look for peaks and troughs that fit the Fibonacci requirements of the XA, AB, BC, and CD legs.
- Confirm with Fibonacci: Use Fibonacci retracement and extension tools to verify that each leg adheres to the expected ratios.
Trading the Bearish Gartley Pattern
Here’s a step-by-step approach to trading the Bearish Gartley:
- Enter Short Position at Point D: Once you identify point D, consider entering a short position, as this is the anticipated reversal area.
- Set Stop Loss Above Point D: Place a stop-loss slightly above point D to manage risk if the price continues moving upward.
- Determine Profit Targets:
- First target around the level of point C for a conservative approach.
- Second target near point A to maximize potential gains.
Benefits and Limitations of the Bearish Gartley Pattern
Benefits:
- Provides high probability reversal points.
- Minimizes risk with well-defined entry and stop levels.
- Relies on Fibonacci levels, which are widely respected in financial markets.
Limitations:
- Complex to identify accurately.
- May produce false signals if market conditions are volatile.
- Requires precise measurements, making experience essential.
Conclusion
The Bearish Gartley Harmonic pattern is a valuable tool for traders looking to capitalize on potential downtrends. By understanding its structure and key levels, traders can enhance their technical analysis skills and make more informed trading decisions. Remember to confirm with other indicators, like RSI or MACD, to validate the reversal potential of this pattern.
If you are looking for Technical Analysis course in Delhi Call us Now 8287996284. Follow us on Instagram @mohsinmahfooz