Bearish Butterfly Harmonic Pattern

Understanding the Bearish Butterfly Harmonic Pattern
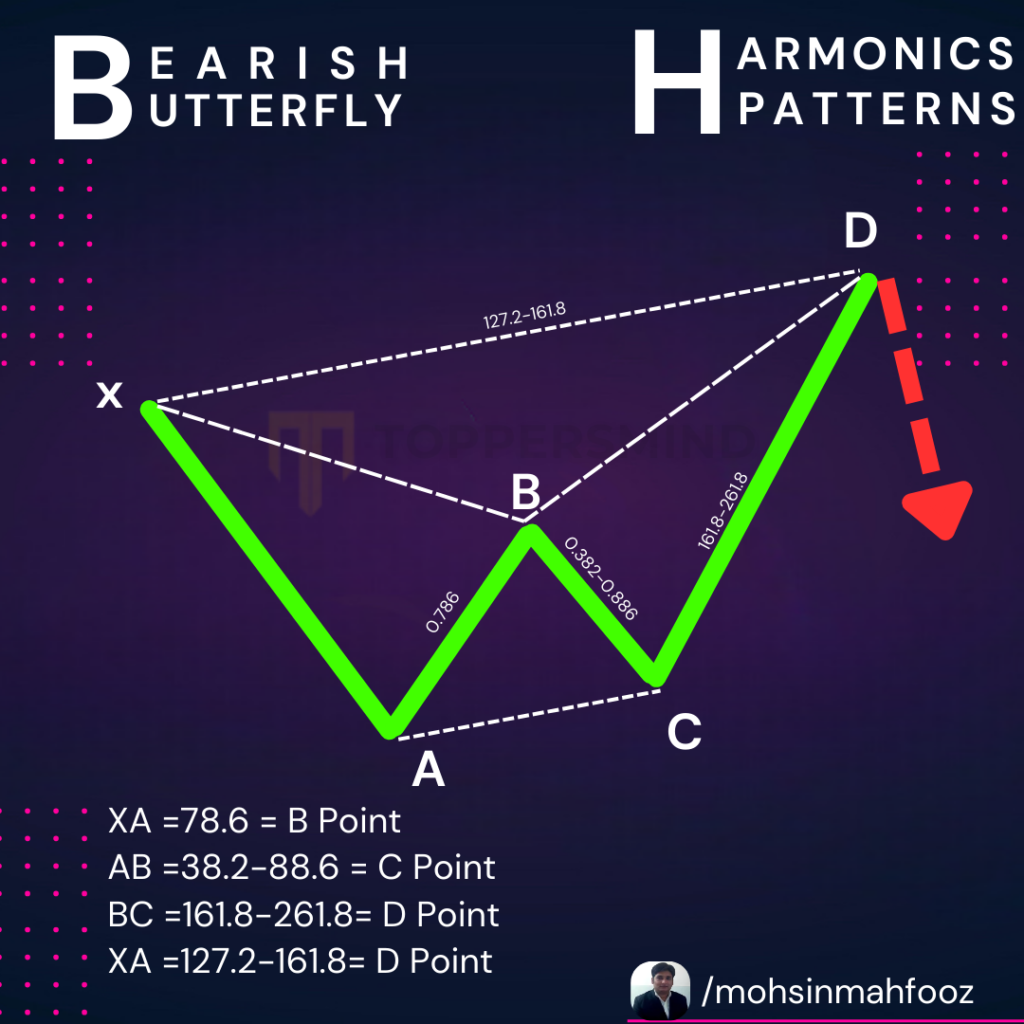
Bearish Butterfly Harmonic Pattern is a powerful reversal pattern in technical analysis. It signals a potential bearish turning point in the market. This pattern is useful for traders looking to capitalize on overextended bullish trends that are likely to reverse. The Bearish Butterfly is formed through a precise combination of Fibonacci ratios, offering defined entry points, stop-loss levels, and profit targets.
Structure of the Bearish Butterfly Pattern
The Bearish Butterfly consists of five key points, labeled X, A, B, C, and D, and follows the same four-leg structure as the Bullish Butterfly. These four legs are denoted as XA, AB, BC, and CD, and are formed by specific Fibonacci retracements and extensions.
- XA Leg: The initial bullish price move from point X to A.
- AB Leg: A retracement of around 78.6% of the XA leg.
- BC Leg: The BC leg retraces between 38.2% and 88.6% of the AB leg.
- CD Leg: The final leg, CD, extends beyond the XA leg, typically reaching the 127.2% or 161.8% Fibonacci extension of the XA leg.
The D point is the most crucial aspect of the pattern, as it represents the Potential Reversal Zone (PRZ), where traders expect the trend to reverse to the downside.
Key Fibonacci Levels in the Bearish Butterfly
- AB Leg: Retraces approximately 78.6% of the XA leg.
- BC Leg: Retraces between 38.2% and 88.6% of the AB leg.
- CD Leg: Extends to 127.2% or 161.8% of the XA leg, marking the point of reversal.
The Fibonacci ratios give this pattern its precision, helping traders identify where the price is likely to reverse after an overextension.
Entry, Stop-Loss, and Targets
- Entry Point: Traders should look to enter a short position around point D, which is at the 127.2% or 161.8% Fibonacci extension of XA. This is the area where the bullish momentum is likely to exhaust, leading to a downward reversal.
- Stop-Loss: A stop-loss is typically placed slightly above point D to account for any false breakouts or minor fluctuations beyond the PRZ.
- Target Points:
- The first target can be set at the 38.2% retracement of the CD leg.
- The second target at the 61.8% retracement of the CD leg, capturing a more significant portion of the potential downward move.
How to Trade the Bearish Butterfly Pattern
- Wait for Confirmation: Traders should wait for bearish price action or reversal candlestick patterns like a bearish engulfing or shooting star near the D point for confirmation before entering.
- Divergence: Adding indicators like RSI or MACD can help confirm the bearish reversal. If the price reaches the D point while the indicator shows divergence, it strengthens the reversal signal.
- Patience and Precision: The Bearish Butterfly requires patience, as it takes time for the pattern to develop fully. Traders must ensure the Fibonacci ratios align correctly before considering any trades.
Example of a Bearish Butterfly Pattern
Consider a scenario where the market is trending upward, forming the XA leg. As the price retraces 78.6% of XA to create the AB leg, the next BC leg retraces around 50% of AB. The final CD leg extends 127.2% of the XA leg, marking point D. As the price reaches D, traders anticipate a reversal and prepare to enter a short position.
If you are looking for Technical Analysis course in Delhi Call us Now 8287996284. Follow us on Instagram @mohsinmahfooz
One Reply to “Bearish Butterfly Harmonic Pattern”
Comments are closed.