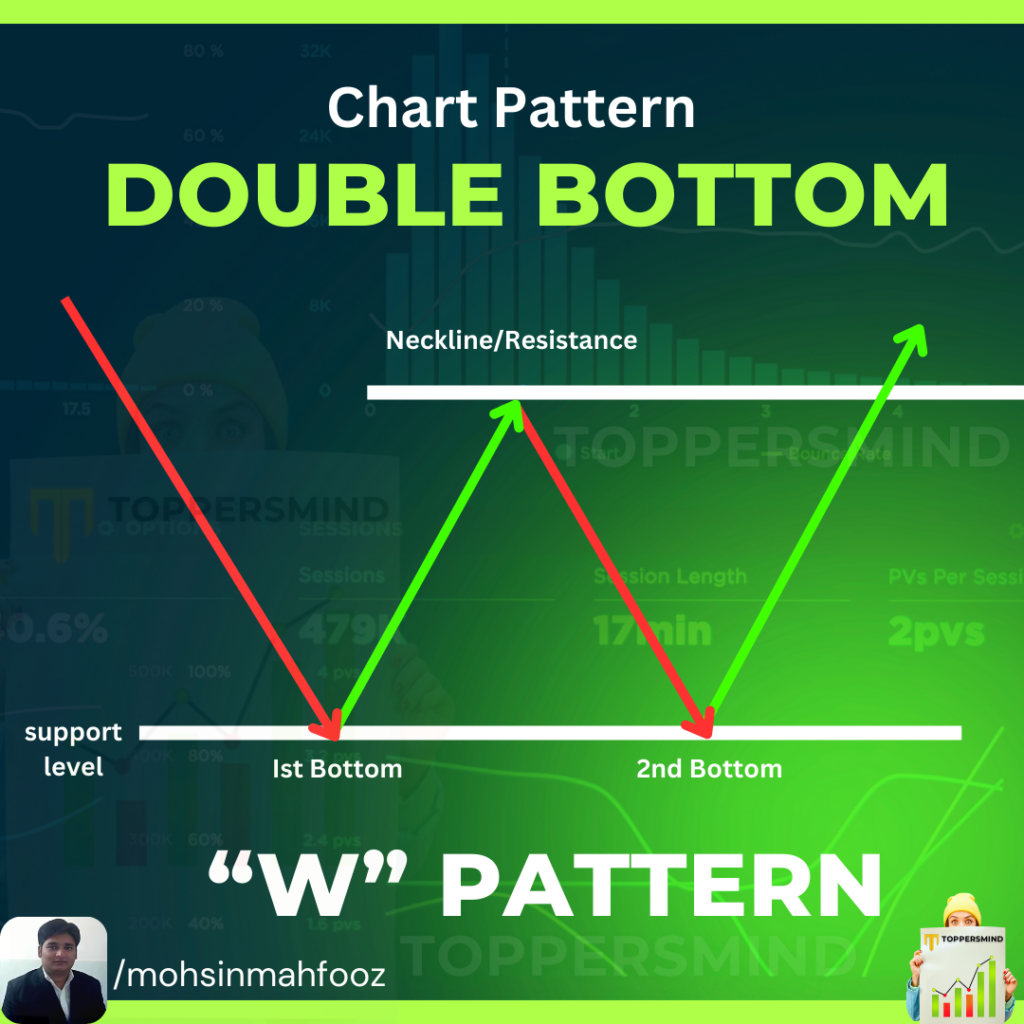
Double Bottom Chart Pattern

The Double Bottom chart pattern is a bullish reversal pattern that signals a potential shift from a downtrend to an uptrend. Here’s a detailed explanation:
Meaning of Double Bottom Pattern
- The Double Bottom is shaped like the letter “W.”
- It occurs after a prolonged downtrend, indicating that the price has reached a level of strong support.
- The two “bottoms” represent two unsuccessful attempts by sellers to push the price lower, showing the weakening of bearish momentum.
- Once the price breaks above the resistance level formed by the intermediate peak between the two bottoms, it confirms the pattern.
Formation of a Double Bottom Pattern
- First Bottom: The price reaches a new low but finds support, causing a temporary upward movement.
- Interim Resistance: The price rebounds but faces resistance, forming the middle peak of the “W.”
- Second Bottom: The price falls again, retesting the previous support level but fails to break below it.
- Breakout: The price rises again and breaks above the resistance level, completing the pattern.
- Volume Confirmation: Volume typically increases during the breakout, confirming the validity of the pattern.
How to Trade the Double Bottom Pattern
- Identify the Pattern: Look for the “W” formation after a downtrend.
- Wait for the Breakout: Enter a trade when the price closes above the resistance level (the neckline).
- Set Stop-Loss: Place a stop-loss below the second bottom to limit potential losses.
- Take Profit: The target price is often estimated by measuring the height of the pattern (from the bottom to the resistance) and projecting it upwards from the breakout point.
Advantages of the Double Bottom Pattern
- Reliability: Provides a strong indication of a trend reversal when confirmed.
- Defined Risk-Reward: Clear entry, stop-loss, and profit-taking levels make it easy to plan trades.
- Works Across Markets: Can be applied to stocks, forex, commodities, and cryptocurrencies.
Disadvantages of the Double Bottom Pattern
- False Breakouts: The pattern may fail if the breakout is not accompanied by sufficient volume.
- Time-Consuming: It takes time to form, which may delay trade entries.
- Subjectivity: Misidentification of the pattern can lead to poor trading decisions
Double Bottom Chart Pattern Also Known as “W” Pattern forms in a downtrend
If you like this article please like, share and subscribe @mohsinmahfooz