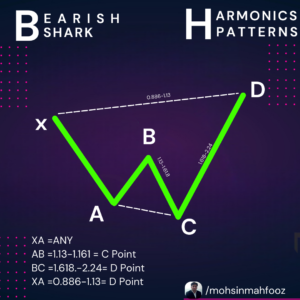
Bearish Shark Harmonic Pattern
A Guide to Identification and Trading

Bearish Shark Harmonic pattern is a lesser-known but highly effective chart pattern used in technical analysis. It helps traders identify potential reversal zones where bearish price action might begin. Let’s dive deep into the structure, identification, and trading strategies associated with this pattern.
What is the Bearish Shark Harmonic Pattern?
The Bearish Shark is a continuation of the harmonic family of patterns and consists of specific Fibonacci retracements and extensions. It is a reversal pattern, appearing during an uptrend to signal the potential beginning of a downtrend.
The key feature of the Bearish Shark is its unique “shark fin”-like appearance, making it visually distinguishable from other harmonic patterns.
Key Structure of the Bearish Shark Pattern
A Bearish Shark is formed with four points labeled as O, X, A, and B. Below are its structural rules:
- O to X: A strong bullish move initiating the pattern.
- X to A: A retracement of the OX leg, typically reaching 38.2%–61.8% of the OX move.
- A to B: A sharp bullish extension, usually between 113%–161.8% of the XA leg.
- B to Potential Reversal Zone (PRZ): The final extension is calculated as 88.6%–113% of the OX leg.
The convergence of these Fibonacci levels at the PRZ indicates the likelihood of a bearish reversal.
How to Identify the Bearish Shark Pattern
- Locate the Initial Impulse Move (O to X): Find a strong upward movement that forms the base of the Shark pattern.
- Measure Retracement (X to A): Confirm the retracement stays between 38.2%–61.8% of the OX leg.
- Spot the Extension (A to B): Use Fibonacci tools to verify the extension aligns with 113%–161.8% of XA.
- Identify PRZ: Ensure the final move extends 88.6%–113% of OX to form the PRZ.
Trading the Bearish Shark Pattern
1. Entry Point:
Enter a short position at or near the PRZ once bearish confirmation (e.g., bearish candlestick patterns or resistance at the PRZ) is observed.
2. Stop Loss:
Place your stop-loss slightly above the PRZ to protect against false breakouts.
3. Take Profit Targets:
- Target 1: The XA retracement level, around 50%–61.8% of the XA leg.
- Target 2: The A point of the pattern for additional profits.
Example of Bearish Shark Pattern in Action
Imagine an upward trend in stock XYZ:
- The price rallies from $100 (O) to $130 (X).
- The price then retraces to $118 (A), aligning with 50% of OX.
- A strong bullish move pushes the price to $140 (B), extending 113% of XA.
- Finally, the price touches $142, completing the pattern at the PRZ.
A reversal occurs, dropping prices to $125, then $118, validating the pattern.
Why Use the Bearish Shark Pattern?
- Precision: Based on Fibonacci ratios, it provides accurate reversal zones.
- Early Signals: Helps traders identify trend reversals before they occur.
- Flexibility: Can be applied to stocks, forex, cryptocurrencies, and commodities.
Conclusion
The Bearish Shark Harmonic pattern is a powerful tool for traders seeking bearish reversal opportunities in a bullish market. By mastering the identification and trading strategies of this pattern, you can improve your accuracy and profitability in technical trading.When trading this pattern, always combine it with other technical indicators and manage your risks appropriately. Happy trading!
If you want to learn Technical Analysis course in Delhi. Call us at 8287886284 & follow us on Instagram @mohsinmahfooz