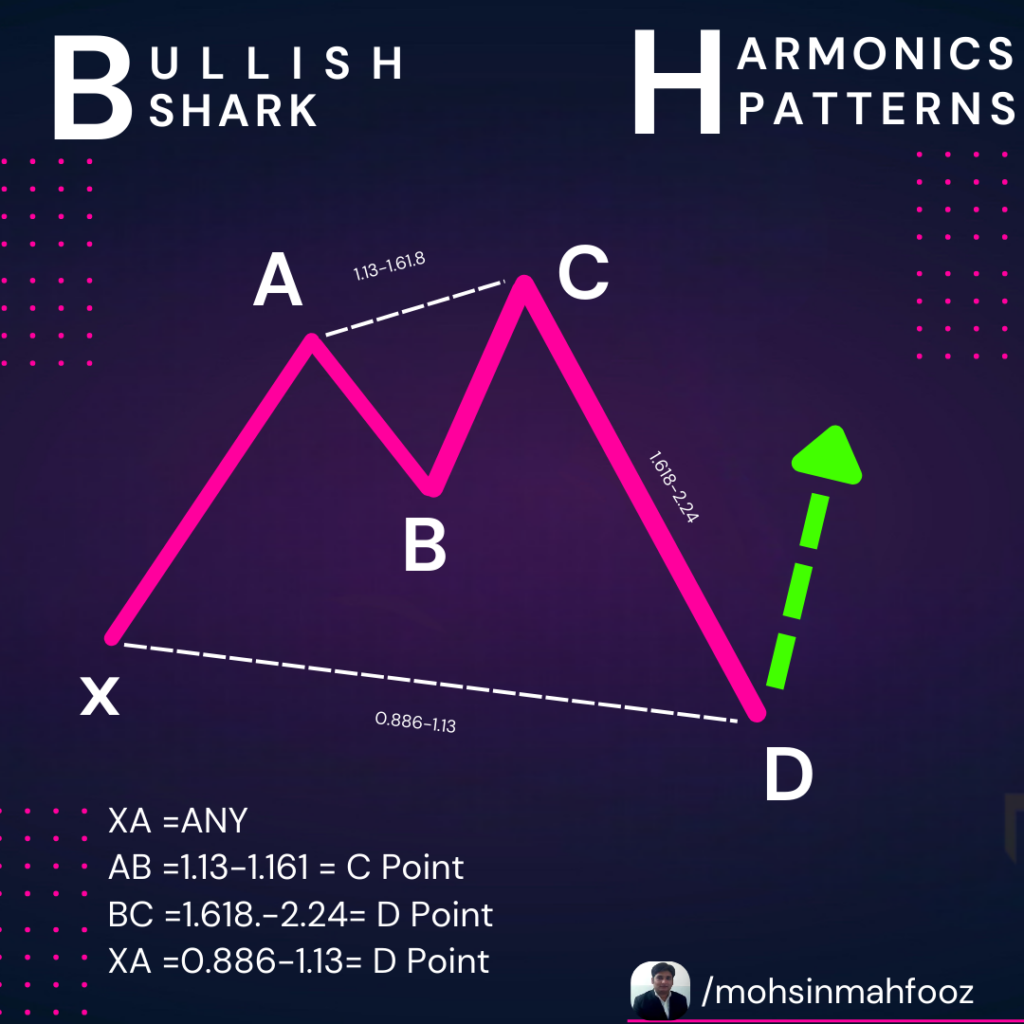
Bullish Shark Harmonic Pattern
A Complete Guide for Traders

The Bullish Shark Harmonic Pattern is a powerful trading pattern used by technical analysts to identify potential bullish reversals in the market. It’s one of the lesser-known harmonic patterns, but it can be highly effective for traders who recognize and implement it correctly. In this post, we’ll dive deep into the structure, formation, and trading strategy associated with the Bullish Shark Pattern.
What is the Bullish Shark Harmonic Pattern?
The Bullish Shark is a reversal pattern that typically forms at the end of a downtrend. It suggests a potential price reversal, providing traders with a buying opportunity. Unlike some other harmonic patterns, the Shark is characterized by its unique structure and ratios, which set it apart from traditional harmonic patterns like the Butterfly or Bat.
Structure of the Bullish Shark Pattern
The Bullish Shark is a five-point pattern, labeled as O, X, A, B, and C. Here’s a breakdown of each point:
- Point O to X: This is the initial move in a downtrend, marking the beginning of the pattern.
- Point X to A: This segment retraces the move from O to X, with an ideal retracement of around 0.886 (88.6%).
- Point A to B: After reaching point A, the price forms a deeper retracement to point B, typically within the 1.13 to 1.618 Fibonacci extension level of segment OX.
- Point B to C: The final segment extends from point B, often reaching the 1.618 Fibonacci extension of segment OX, completing the pattern at point C.
Fibonacci Ratios:
- O to X: No specific ratio, as it’s the starting point.
- X to A: 0.886 retracement.
- A to B: Between 1.13 to 1.618 extension.
- B to C: 1.618 Fibonacci extension of segment OX.
This precise structure and these ratios create the foundation of the Shark pattern.
How to Identify the Bullish Shark Pattern
Identifying a Bullish Shark pattern involves:
- Recognizing the Five Points: Accurately marking points O, X, A, B, and C is crucial.
- Applying Fibonacci Ratios: Use a Fibonacci tool to measure retracements and extensions between points and confirm pattern validity.
- Looking for a Reversal Signal: At point C, check for bullish reversal indicators like candlestick patterns or momentum oscillators to confirm the reversal.
Trading the Bullish Shark Pattern
To trade the Bullish Shark pattern effectively, follow these steps:
- Entry Point: Enter a buy position at point C, as it’s expected to signal the end of the downtrend and the start of a bullish reversal.
- Stop Loss: Place a stop-loss slightly below point C to protect against false breakouts.
- Take Profit: There are multiple profit targets in harmonic trading:
- Target 1: Point A, which typically sees a retracement after the initial move.
- Target 2: Point X, as price may reach back toward this point in a strong reversal.
Practical Tips for Trading the Bullish Shark Pattern
- Confirm with Other Indicators: Use indicators like the Relative Strength Index (RSI) or Moving Average Convergence Divergence (MACD) to confirm bullish momentum at point C.
- Adjust for Market Conditions: Remember that volatile markets can cause deviations in pattern formation, so be cautious and flexible with entries and exits.
- Practice on Demo Accounts: Especially for beginners, practice recognizing and trading the Shark pattern on a demo account before trading with real money.
Advantages and Limitations
Advantages:
- The Bullish Shark pattern can be highly accurate in predicting reversals.
- It provides clear entry, stop-loss, and take-profit levels, helping traders manage risks effectively.
Limitations:
- The Shark pattern requires strict adherence to Fibonacci ratios, which can be complex for beginners.
- Patterns don’t always play out perfectly, so additional confirmation is needed to increase the success rate.
Conclusion
The Bullish Shark Harmonic Pattern is an advanced but rewarding pattern for traders who can recognize it accurately. By following the specific structure and Fibonacci ratios, traders can find reliable reversal opportunities, especially when combined with other technical analysis tools.
If you are looking for Technical Analysis course Call us Now 8287996284. Follow us on Instagram @mohsinmahfooz