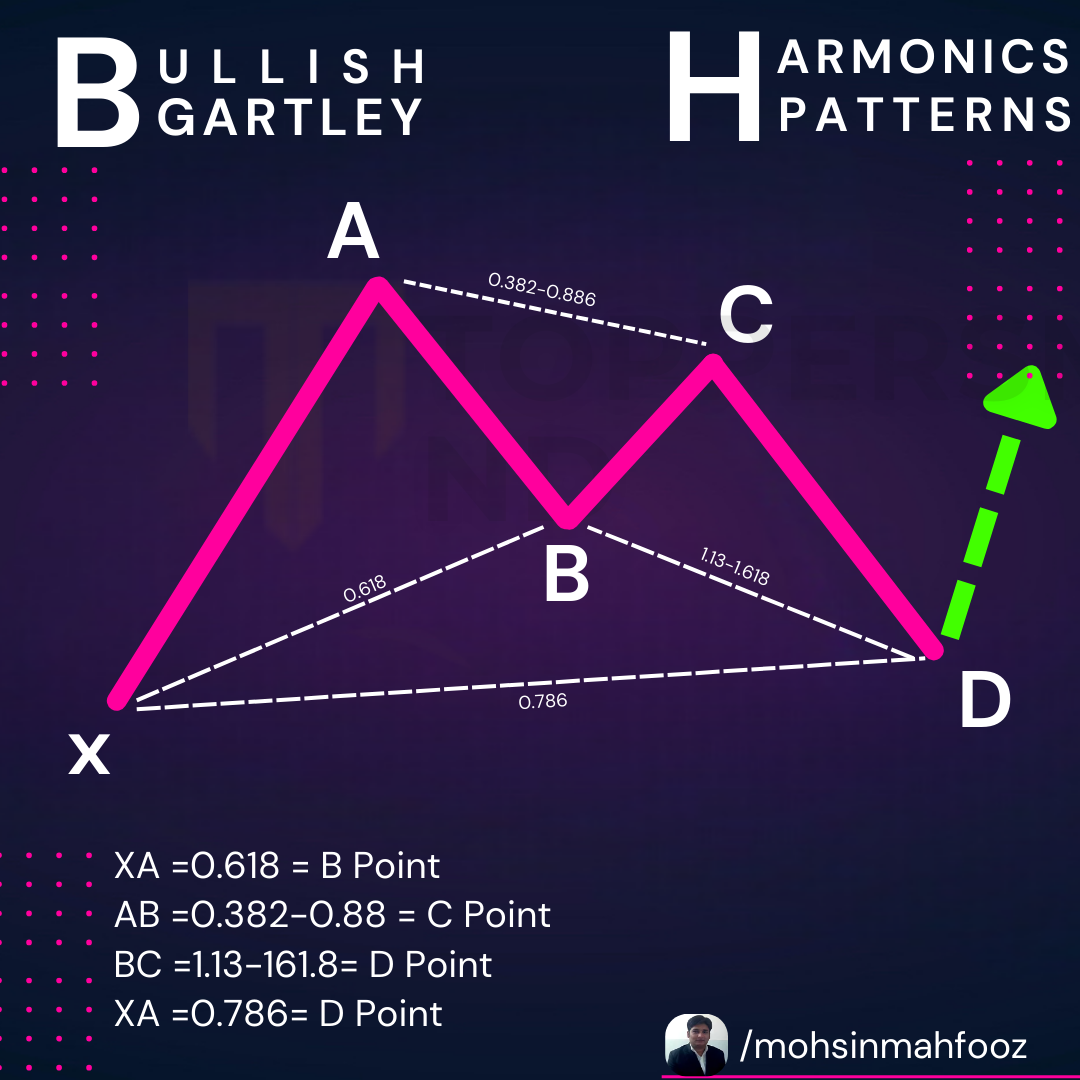
Bullish Gartley Harmonic Pattern
The Bullish Gartley Harmonic Pattern is one of the most recognized and reliable harmonic trading patterns in technical analysis. It’s favored by traders because it signals potential reversals in the market, providing high-probability entry points. This blog post will explore the key aspects of the Bullish Gartley pattern, how to identify it, and how traders can use it to improve their trading strategy.

What is the Bullish Gartley Harmonic Pattern?
Bullish Gartley Harmonic Pattern: The Bullish Gartley is a four-legged price structure that resembles the letter “M” and indicates a bullish reversal in a downtrend. The pattern was first introduced by H.M. Gartley in his book Profits in the Stock Market, and later, it was refined by traders like Scott Carney to provide specific Fibonacci ratios that make this pattern more precise and tradable.
This harmonic pattern typically occurs when the market is in a temporary corrective phase before continuing its uptrend.
Key Characteristics of the Bullish Gartley Pattern
To accurately identify the Bullish Gartley, you need to look for specific price movements and Fibonacci ratios, which are crucial in confirming this pattern.
- XA Leg: This is the first leg and represents a significant price move upwards.
- AB Leg: The price retraces from point X to point B, usually retracing 61.8% of the XA leg.
- BC Leg: After the AB retracement, the market reverses again and moves from B to C, typically retracing between 38.2% to 88.6% of the AB leg.
- CD Leg: The final move is a bullish extension from point C, completing the pattern at point D. This leg often reaches 127.2% or 161.8% of the BC leg.
Fibonacci Levels to Watch
The Bullish Gartley pattern is defined by specific Fibonacci ratios, making it crucial to measure retracements and extensions accurately. The ideal Fibonacci levels for the pattern are:
- AB retraces XA: 61.8%
- BC retraces AB: 38.2% – 88.6%
- CD retraces BC: 127.2% – 161.8%
- D is a retracement of XA: 78.6%
Point D is the key reversal zone, and traders typically enter long positions here, anticipating a bullish reversal.
How to Trade the Bullish Gartley Pattern
- Identify the Pattern: Use a Fibonacci retracement tool to check whether the price action follows the specific ratios mentioned above.
- Enter the Trade: The ideal entry point is at point D, where the price is expected to reverse. You can set your buy order here after confirming the pattern.
- Set a Stop-Loss: It’s advisable to place your stop-loss slightly below point D to protect yourself from unexpected moves.
- Take Profit Levels: The initial profit target is typically set at the 38.2% retracement level of the AD leg, with further targets at 61.8% or higher, depending on the strength of the reversal.
Why is the Bullish Gartley Effective?
The Bullish Gartley pattern is effective because it combines the power of Fibonacci retracements and extensions with harmonic price action. It gives traders clear guidelines for entry, stop-loss, and take-profit levels, making it easier to plan trades with defined risk-reward ratios. Additionally, the Bullish Gartley often forms near key support levels, further increasing its probability of success.
Final Thoughts
The Bullish Gartley Harmonic Pattern is a powerful tool for traders looking to capitalize on bullish reversals. By learning to spot this pattern and understanding the key Fibonacci levels involved, traders can gain an edge in the market. As always, it’s essential to confirm the pattern with other technical indicators, such as RSI or MACD, to increase the probability of a successful trade.
If you are looking for Technical Analysis course in Delhi Call us Now 8287996284. Follow us on Instagram @mohsinmahfooz